Report estimates Baltimore-area drivers lose nearly $3,000 yearly from rough roads, crashes, and congestion delays
What the estimate includes
Baltimore-area motorists are losing nearly $3,000 per driver each year due to a combination of deteriorated roadway conditions, congestion-related delays, and crash-related costs, a transportation research analysis found. The estimate aggregates three major cost categories: vehicle operating costs linked to rough pavement, the economic value of time and fuel lost in traffic, and costs associated with traffic crashes in which roadway design and safety features may have played a contributing role.
Road condition and vehicle wear: A large share of the region’s locally and state-maintained roads were rated in poor or mediocre condition. The analysis attributes roughly $950 per driver per year in additional vehicle operating costs to pavement-related wear and tear, including items such as repairs and accelerated maintenance.
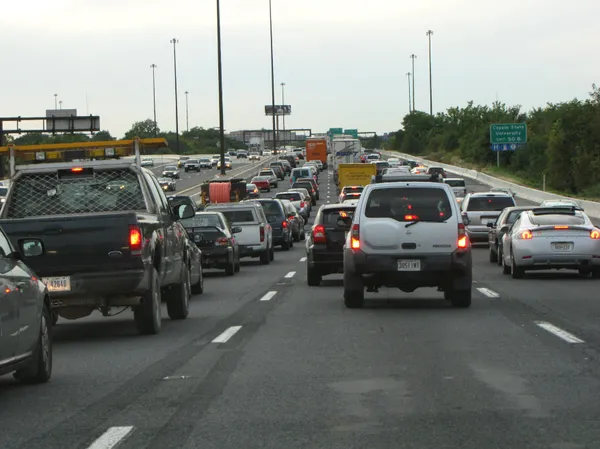
Congestion delays: The typical driver was estimated to experience about 68 hours of annual delay from congestion, with about $1,500 per driver in lost time and wasted fuel.
Crash costs: The report includes costs tied to traffic crashes, noting that while roadway safety features are not generally the primary cause of crashes, they can contribute to their severity and frequency.
Road quality and safety indicators
The assessment describes Baltimore as having one of the higher concentrations of subpar pavement in the state. Condition ratings are based on federal and state roadway data used to categorize major roads as good, fair, mediocre, or poor. A separate statewide snapshot included in the same analysis finds that about five percent of Maryland bridges are rated poor/structurally deficient, indicating significant deterioration in key structural components.
The report’s methodology treats transportation costs as the combined impact of rough roads, congestion, and crashes rather than a single-cause explanation.
Why the “nearly $3,000” figure matters locally
While the estimate is expressed as an average per driver, its implications are regional: higher operating costs can affect household budgets, fleet maintenance, and the reliability of commuting and deliveries. The report frames these costs as recurring losses that accumulate annually when road repairs lag, congestion persists, and safety improvements are delayed or incomplete.
What the numbers do—and do not—show
The figures are not a bill sent to drivers, and they do not indicate that every motorist pays the same amount. Instead, the report converts measurable transportation conditions into dollar estimates using established cost models for vehicle wear, travel time, and crash impacts. The analysis also cautions that roadway conditions and safety features interact with factors such as traffic volume, driver behavior, vehicle mix, and land-use patterns, meaning the costs can vary widely by corridor and by driver.
The report’s bottom line for Baltimore-area residents is that infrastructure condition and traffic performance are being translated into annualized, household-scale costs—providing a benchmark for evaluating road maintenance needs, congestion management strategies, and safety investments.